Which Keywords Should My Business Rank for in Google?

Christopher Hofman Laursen
January 10, 2019
Which Keywords Should My Business Rank for in Google?
Are you focused on questions such as “How can we get more traffic from Google?”, or “How do we get our keywords to rank higher?”.
Surely, they are relevant questions, but I got a better one for you:
“Which keywords are the most valuable for our business to rank for in Google?”
The two initial questions focused on getting more traffic. However, it does not necessarily lead to more revenue.
My question focuses on which keywords can generate sales for us short term or in the long run.
In this post I will explain how you can identify the most valuable keywords to rank for in Google, and at the end I will reveal how I use AccuRanker when executing.
Ready to generate some more revenue?
Let’s get started.
Should We Accept That SEO is a Long Game?
Ever heard any variation of the quote below?
“SEO is about the long game, where you struggle for years before reaping the rewards”.
This type of quotes seems to be the “truth”, preached by SEOs to their colleagues and their clients.
However, I do not agree.
I believe that most times, the slow SEO progress is due to focusing on the wrong keywords. Many SEOs are way too eager to go after high search volume keywords instead of the ones that have the potential to generate revenue.
Going down the wrong road will cause a lot of time wasted.
Firstly, you will spend time ranking high for the wrong keywords, and secondly, when you finally succeed, you will spend time finding out why they do not bring in any business.
It’s a shame.
However, it is actually avoidable, since two shifts have happened that help us to do better SEO.
Two Major Shifts to do Better SEO
While many SEOs are blinded by the new shiny things such as voice search or daily Google updates on Search Engine Land, I believe there are two major shifts, that are the key to better SEO results.
1. We have better data than ever
Google Keyword Planner is now only one of many sources of data to understand what people search for, and it is not even the best resource we have. By now, clickstream-based tools, analytics tools, and specialized SEO tools provide us with better insights. It seems that they have been around forever, but a brilliant rank tracking tool such as AccuRanker only got their big breakthrough a couple of years ago.
2. There are now better tools to work with large data sets
Ever waited for Excel crunching a large data set?
We all have.
While Excel has been every SEO specialist’s best friend for the last decades, it is time to face the facts. You should not read articles like the one below to fix the problem.

Now, we can all be data scientists. In fact, if you want to crush it with SEO over the next years, this is a required skill.
And it is therefore time to make a tough but correct decision.
Yes, I said it. You should skip Excel as your go-to tool.
I am not saying that it is still not useful, but it is not enough. And it is not the central tool for insights.
There are better alternatives, and the great thing is that they are free of charge.
Over the last year, I have become a huge fan of Microsoft’s Power BI and in this post, I will show you why.
Kudos to Wil Reynolds from Seer Interactive for leading the way. Visionaries like him are rare in the industry.
How to Find the Most Valuable Keywords for Your Business
After this rant, let us go back to the initial question.
In the following example I will show you the step by step process to find the most valuable keywords for your business via Power BI:
Step 1 - Retrieve three data sets from Google Analytics and Google Search Console
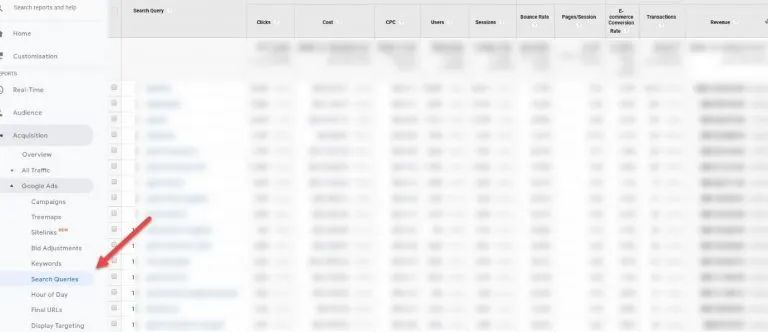
We want to merge data from Google Ads’ search queries with our Google Search Console data. The idea is that if we can identify the paid search queries generating transactions, we can look at our ranked organic keywords to look for opportunities.
First, we download the last 12 months’ search queries from our Google Ads account. Make sure to sort it by turnover. In the example below I retrieved 2.000 search queries, which have generated transactions this year.
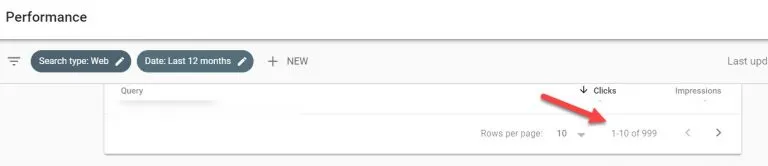
Secondly, we download the last 12 months of data from Google Search Console. If you extract the data from Google Search Console directly, then you only get 999 rows of search queries.
That is not enough.
Instead, you could use the API to get more data, however I use another workaround.
To get all the search queries, get the add-on for Google Sheets called Search Analytics for Sheets. We connect it to our Google Search Console account, and we can then request all the queries from the last 12 months.
Instead, you could use the API to get more data, however, I use another workaround.
To get all the search queries, get the add-on for Google Sheets called Search Analytics for Sheets. We connect it to our Google Search Console account, and we can then request all the queries from the last 12 months.

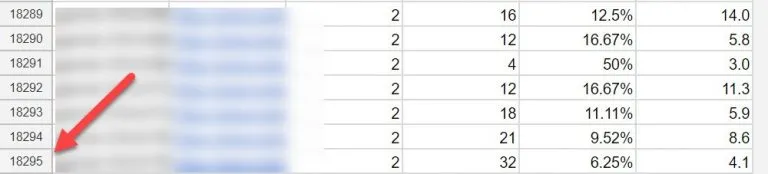
That’s better – Instead of 999 I have now retrieved 18.295 search queries.
We download the data as an Excel file.
Since we want the current ranking, we have to retrieve a second data set from Google Search Console, where we retrieve the same data as before. The only difference is that the date range is today’s date.
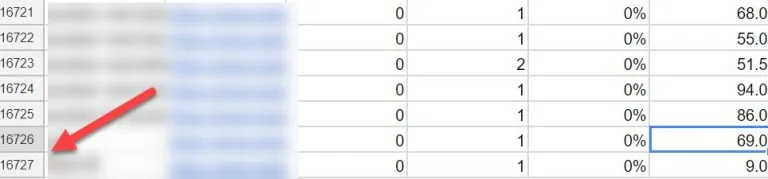
The fresh ranking data set contains 16.727 of the 18.295 keywords we picked up in the first Google Search Console data set.
Not bad.
We now have all the data needed.
Before moving on to step 2, let me briefly summon up what happened:
A. We got the last 12 months of data of Google Ads search queries. In this example, we identified 2.000 queries, which generated revenue for us during the period.
B. We retrieved the full list of search queries which we rank for in organic search via Google Search Console. In this case +18K search queries.
C. We got today’s current ranking for +16K of the keywords via Google Search Console.
These three data sets are a solid foundation to get some insights. Let’s move on and import them into Power BI.
Step 2 – Import the data into Power BI, clean it and connect it
If you still have not downloaded Power BI, then it is time. Go and download it now.
We need to enter the three Excel files into Power BI via Get Data in the top menu.
There are two key factors to make the data ready for later visualizations: The data should be cleaned and then connected to each other.
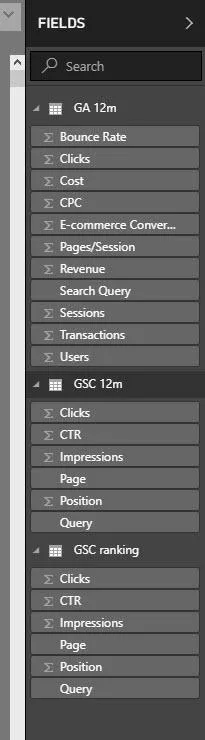
First you clean the data. Click Edit queries in the top menu. Go through each data set and make sure that each column has the right format (text or numbers). In order to avoid any issues, I also suggest that all words should be converted to lowercase.
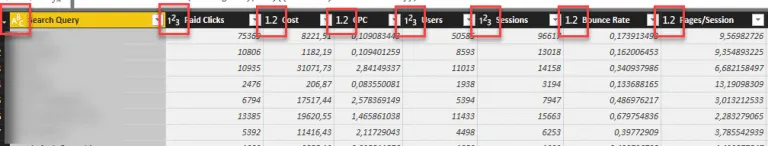
Change the name of each data set to something you can understand, so you do not mix them up. In this example I call them GA 12m, GSC 12m and GSC ranking as seen below:
The second part of the cleaning is to make sure that we only have unique search queries in the two Google Search Console data sets, in order to be able to connect them to the Google Search Ads data set.
Therefore, we need to set the column position in both data sets to ascending, to get the best positioned queries appearing first. When that’s done, mark the search query column and remove duplicates.
Close and Apply.
Now it is time to combine the three data sets, so we can get some nice insights.
We go to Manage relationships in the top menu, choose New, Create a relationship between the Search query columns and select Many to one.
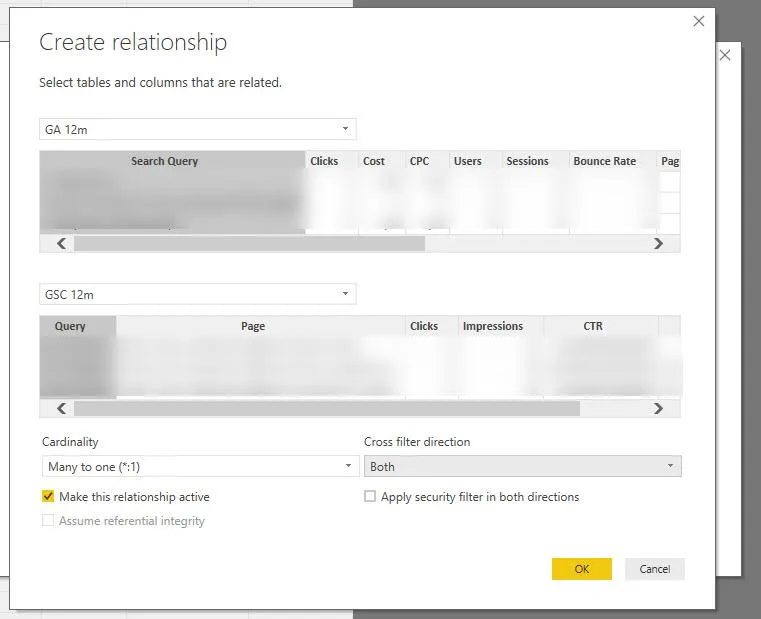
If the data sets cannot be connected, then you have to go back to your data sets and see, if the columns are in the right formats, and ensure that duplicates have been removed.
We have now imported the data, cleaned it and connected it so we are ready to visualize the data to find some valuable insights.
Step 3 - Visualize the data and analyze the data for insights
After creating the relationship between the data sets, we should be able to combine data.
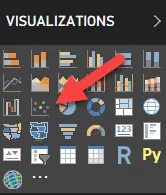
Click the Visualization tab to the left.

You will now see a white canvas. Pick the scatter chart in Visualizations on the right.
In the GSC 12m data set, drag and drop Query into the Details field.
Then you drag and drop Position into the X axis field. Finally, drag and drop Impressions into the Y axis field.
The scatter chart will look weird, so make sure to select Minimum instead of the default Count of …. for the two last data entries.

Now click the Format icon to make the last design improvements.
You have to turn on Display Category Labels, and I also recommend to turn on Color by category.
Below you now have the completed scatter chart using my example:
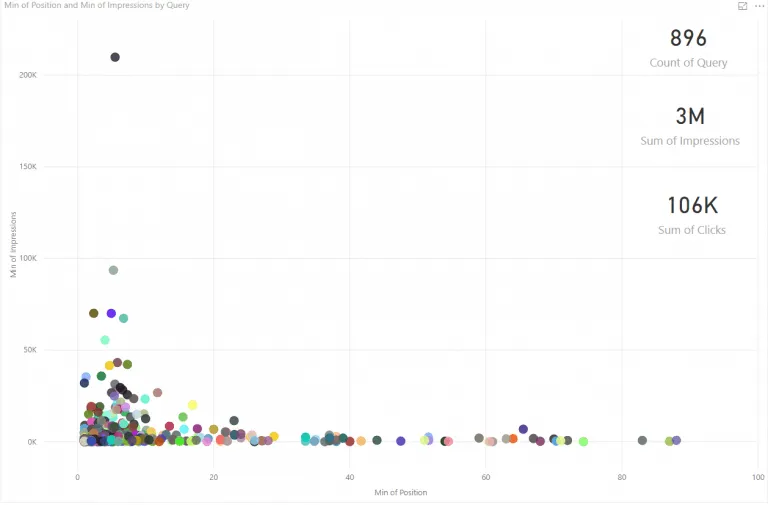
Each bubble is a keyword (I have removed the keyword label). On the X axis you can see its organic ranking in Google from 1 to 100. On the Y axis you can see the number of annual impressions.
I have inserted some Cards from Visualizations. In the end we found 896 keywords represented in all data sets representing 3 million annual impressions and 106.000 clicks.
This is already interesting, however, this is when it gets exciting.
You now drag Revenue from the GA 12m data set into the field Size (select minimum).
Boom!
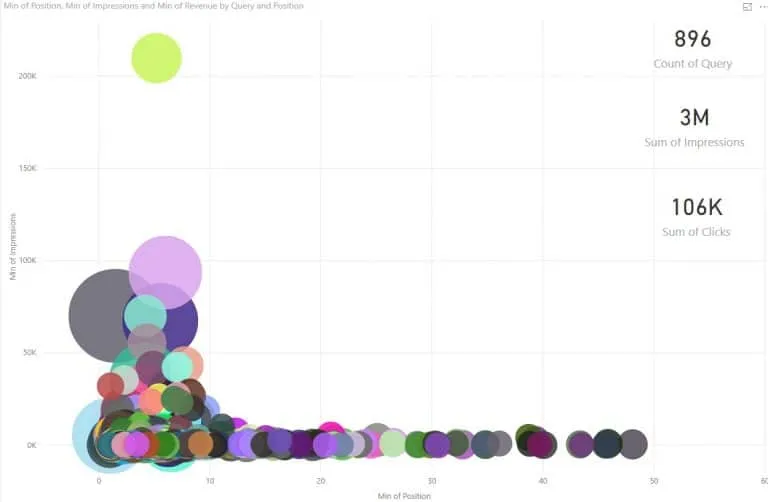
Now we can see, which search queries gave us the highest revenue in Google Ads over the last 12 months.
However, bear in mind that we look at the average ranking for the last 12 months. The average ranking could be very different from the current one. Therefore, we need to combine the two data sets with the last data set GSC ranking to get the current ranking.
Go to Manage relationships and create the connection between the two GSC datasets. When done, insert the Position from GSC ranking as the X axis. Now you have your most important search queries.
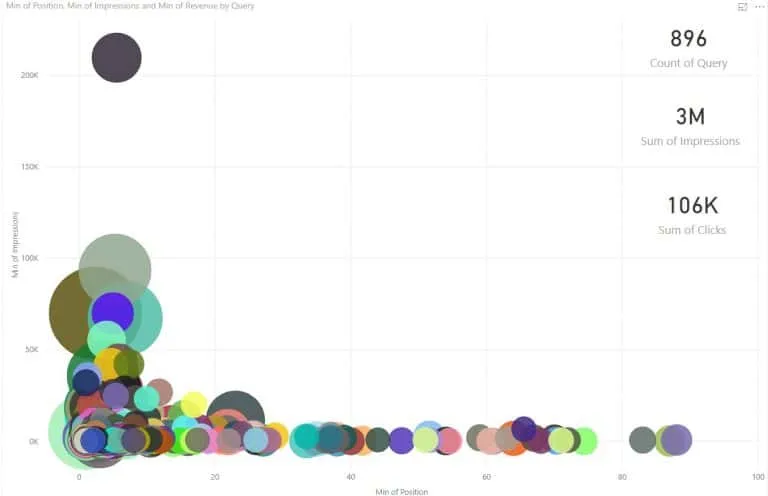
You are now ready to make a deep dive and find the most interesting keywords to work with. You can already gain insights now, however, I still recommend that you go deeper, and look at the traffic and revenue potential as well.
In the example above there are some bubbles which look promising. If it is a big bubble and it ranks in the position 4-20 with a reasonable traffic volume, it might be the obvious ones to go after.
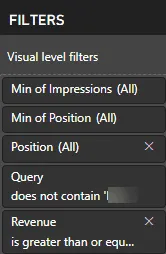
However, with so many bubbles in the chart it is important to use the Filter options. You can use it to exclude or include certain keywords (e.g. brand queries), filter by position (e.g. only look at position 5-20) or look at keywords with a higher search volume (e.g. more than 100).
I could go on and on about the data analysis, however, for now make this exercise and then build upon it as you go.
To sum up:
When you combine data sets you will get unique insights, which will make your execution more precise. Instead of looking only at the search volume, you can easily combine this data with a layer of revenue keywords from Google Ads to know which keywords generate orders. While it is easy to get carried away by the keywords that can bring in thousands of extra visits, this analysis can prevent you from going in the wrong direction.
Since we are on the AccuRanker blog, I have included a bonus section how I use AccuRanker as part of the execution.
BONUS – How to use AccuRanker to execute on my Power BI insights
I found the keywords generating revenue before. Now I want to improve rankings in Google. In the end I added 851 search queries ranking on the first four pages of Google to my account in AccuRanker.
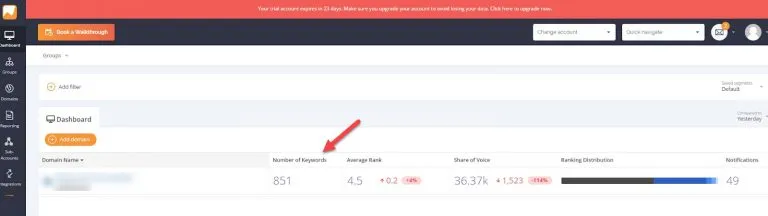
So how to tackle this huge list going forwards?
What I will do is tag each keyword into three buckets (Defend, Attack or Build) based on their position.
Top 3 rankings: Defend
These are your cash cows. You need to defend them actively, since they are on your competitors’ radar. And the competitors are not sitting still.
4-20 positions: Attack
These are your future cash cows. If you rank for one of these keywords at the bottom of page 1 in Google, you probably get 0,5-1% traffic of the total search volume. Move it to the top 3 and you will get 5-20% of the traffic. Now that you know your Google Ads revenue, you can work out the revenue potential in the organic listings.
Outside the top 20: Build
If we leave out any possible technical obstacles or a low domain authority, then the reason you do not rank on the first two pages in Google is due to not delivering on the user intention. In that case, you have to re-position your existing pages and create new ones which fulfill this need.
In our example, the 851 keywords are distributed like this:
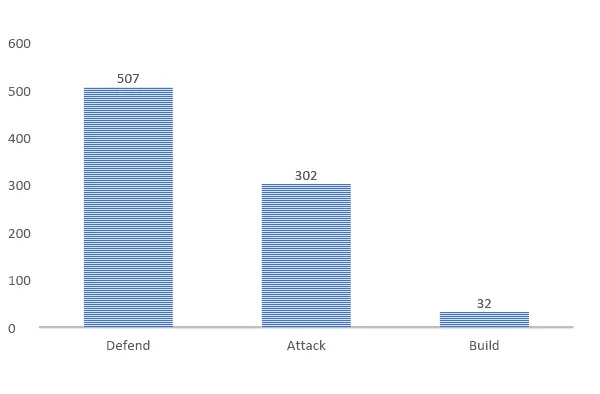
You can now follow the development routinely to know how well it is doing. At the same time, you will know how to work with the given keyword.
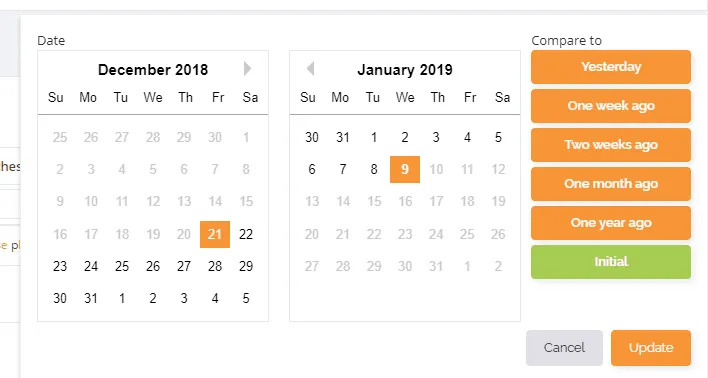
When you want to check the status of your project, you select the filter Compare to initial in AccuRanker. You then export the data to Excel.
Add a column after the Tags column and insert the following formula. My column is L and here I have my full list of keywords:
=IF(L1:L852<=3;”Defend”;IF(L1:L852<=20;”Attack”;IF(L1:L852>20;”Build”)))
You have then created an updated tag, where you can set up a chart such as the one below, following the development.
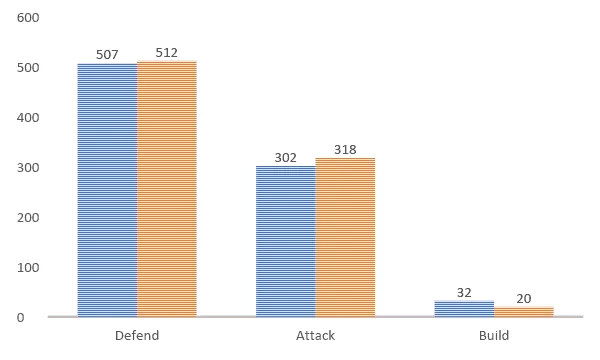
I found this to be a good way of knowing how well I am doing, while making it an agile process.
That is it for now. I hope you are fired up to try out working in Power BI. If you have any questions then do let me know in the comments section below.
Related blog posts

How SERP Layout Is Killing Your Organic Traffic
Why is your rank 1 not driving traffic? Learn how to measure real SERP visibility with pixel position, SERP feature tracking, and dynamic CTR.
12 May 2026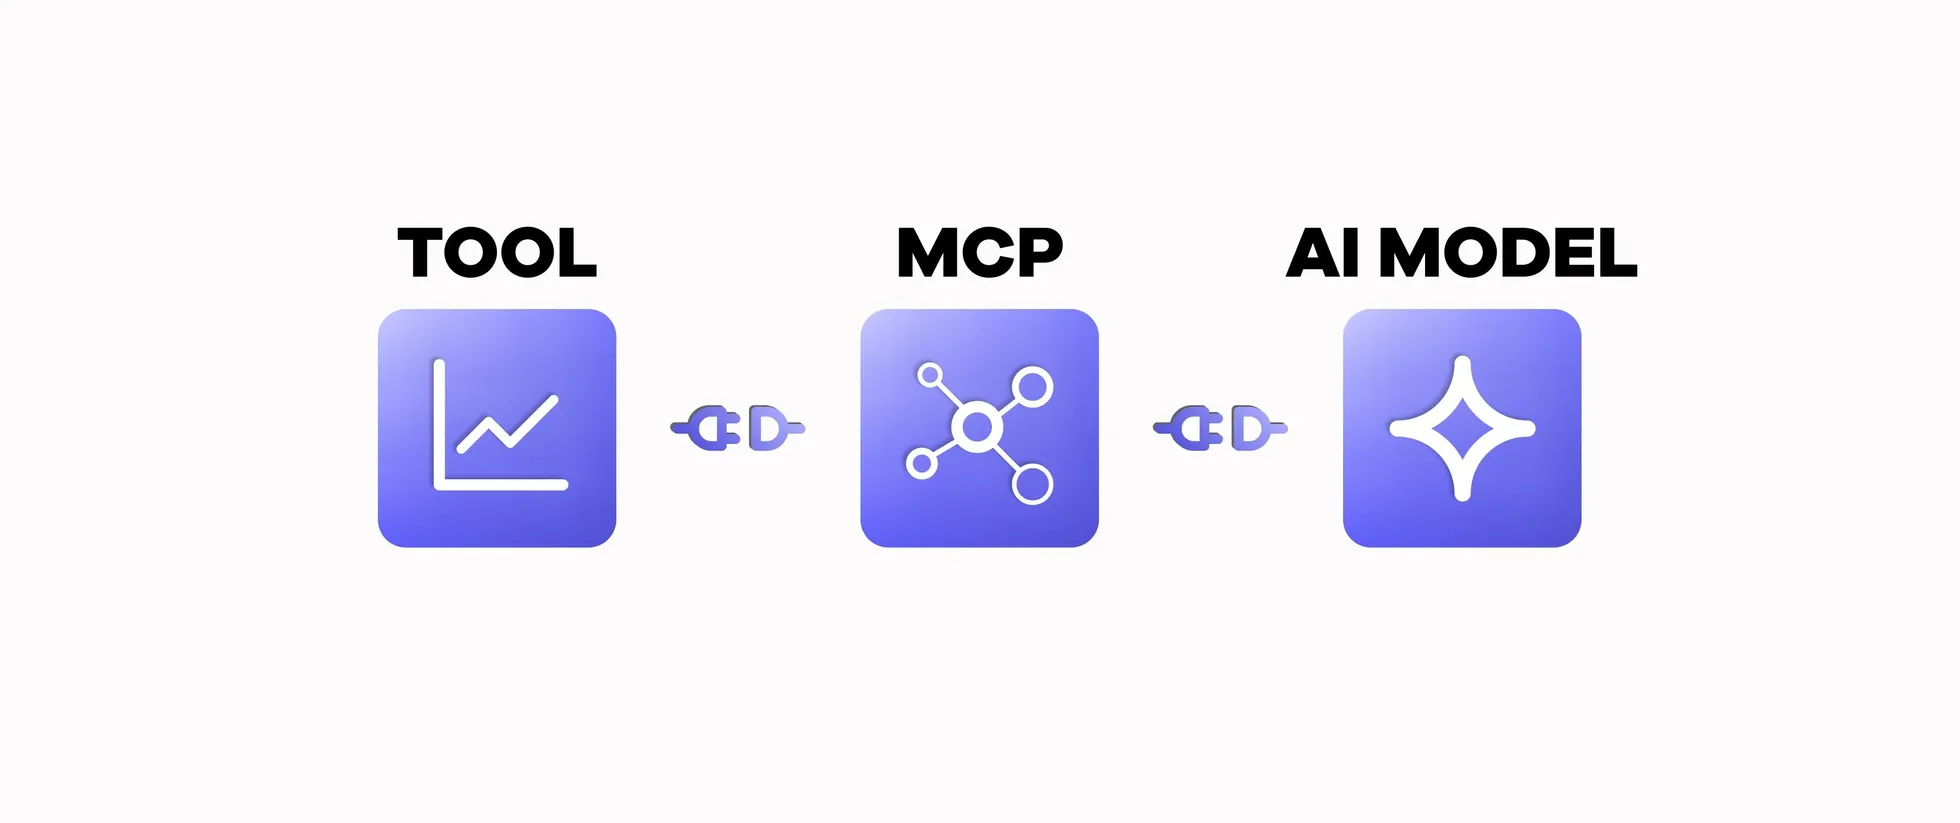
What Is MCP and Why Is It Useful in SEO?
A Model Context Protocol (MCP) connects AI models to external tools. Learn how MCP works and why it is helpful in SEO.
8 April 2026
The Hidden Flaws in Search Volumes and How to Solve Them
Learn how AI Search Volume delivers reliable search volumes by combining GKP, GSC, and Trends so that you can prioritize the right keywords.
30 March 2026