

A New Dynamic CTR Model Built for Today’s SERPs

Peter Emil Tybirk
October 7, 2026
Learn why we rebuilt our Dynamic CTR model and how it delivers more accurate CTR estimates based on real click behavior and today’s SERPs.
On 21 October 2026, we replace the model behind Dynamic CTR. For most keywords, this means the estimated CTR will decrease. As a result, your Share of Voice and Traffic Value will also go down. Your rankings, real traffic, and position relative to your competitors remain unchanged.
What Changes on 21 October, 2026
If you use Dynamic CTR for Share of Voice, which is our recommended setting, you will see lower estimated CTRs for most keywords:
| Average estimated CTR per tracked keyword | Desktop: before → after | Mobile: before → after |
|---|---|---|
| Rank 1 | 22.6% → 10.6% | 18.2% → 11.2% |
| Rank 2–10 | 4.0% → 1.4% | 3.4% → 2.3% |
| Rank 11–20 | 1.1% → 0.2% | 0.8% → 0.4% |
- For the median domain, Share of Voice falls by about half (−48%). Half of all domains fall by between 32% and 64%.
- The change is bigger on desktop than on mobile. The median is −62% against −39%.
- About 4% of domains go up.
Your competitors move on the same day
The new model applies to all domains simultaneously. We tested the impact across 3,414 tracked domains and found that the order of domains by Share of Voice remains almost the same before and after the change (rank correlation 0.98).
In other words, your Share of Voice may be lower, but your position relative to your competitors is largely unchanged. Therefore, compare yourself with your competitors, not with your own numbers from before 21 October 2026.
Your history stays as it is
Values from before 21 October 2026 keep the numbers calculated with the previous model. This means charts that use Dynamic CTR will show a step on that date.
If you report Share of Voice to clients or stakeholders, mark the date in your reports.
Some things do not change at all
Your rankings stay the same, and so do your clicks in Google Search Console and in your analytics.
If you use Static CTR, the new model does not apply to your Share of Voice. You can switch between Dynamic and Static CTR at any time in Account settings. Share of Voice also becomes one configurable metric on the same day; this blog post explains the settings.
Why the Estimate Goes Down
AI Overviews are spreading and taking clicks
AI Overviews now appear on most of the Google SERPs we track. On 30 September 2026, an AI Overview was on 66% of tracked desktop results and on 59% of mobile results. In July 2026, those numbers were 48% and 38%.
The biggest change happened in September. In just one month, the share of commercial and transactional searches with an AI Overview almost doubled.
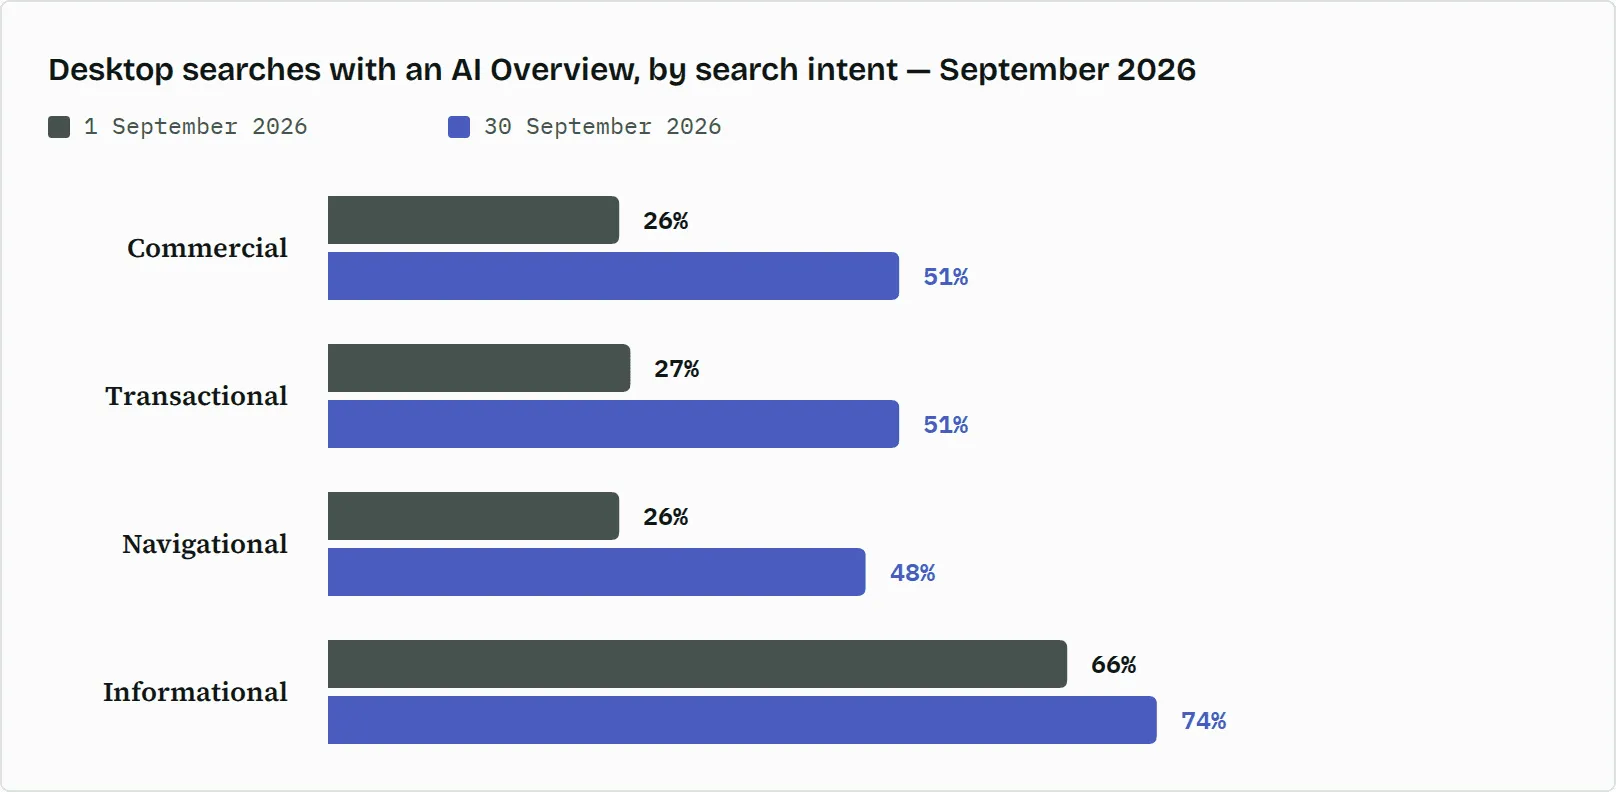 Desktop searches where a tracked domain ranks first, grouped by search intent, on 1 and 30 September 2026.
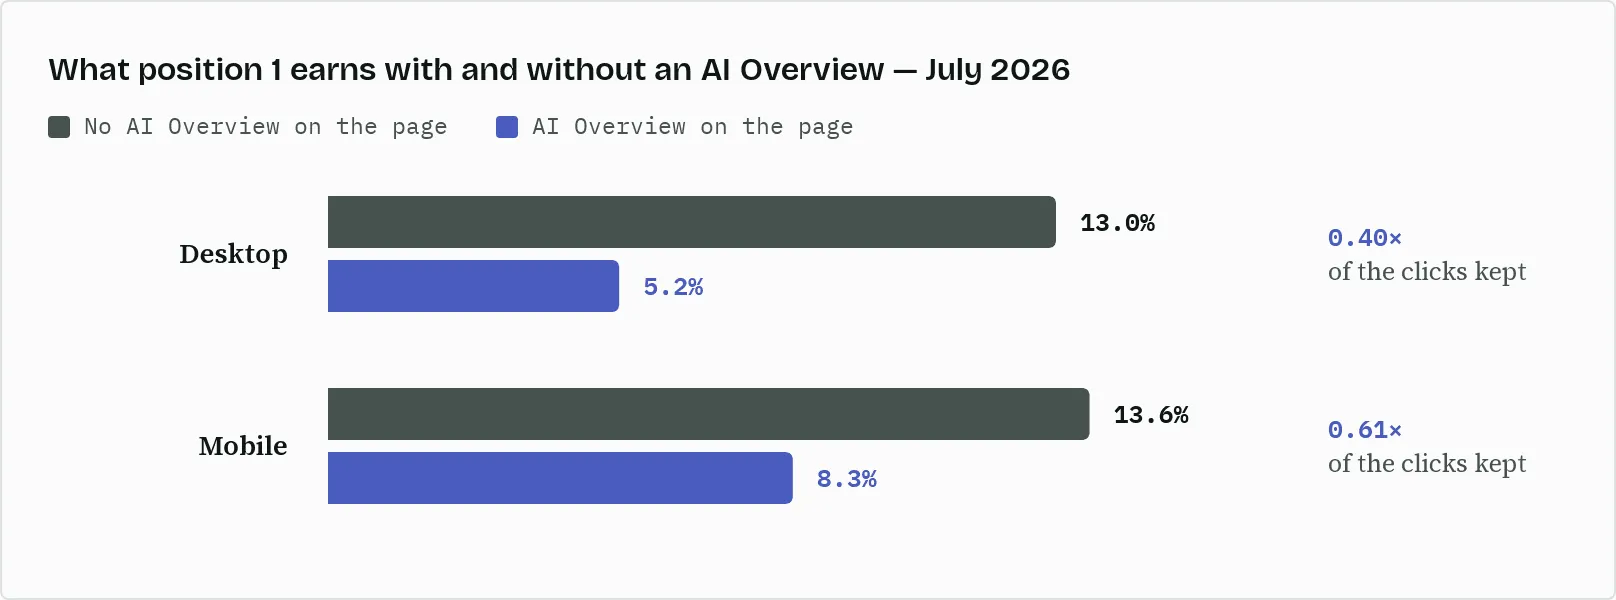
This matters because AI Overviews take clicks from organic results. In July 2026, a desktop result at position 1 earned 13.0% CTR on a page without an AI Overview, and 5.2% on a page with one. On mobile, the numbers were 13.6% and 8.3%.
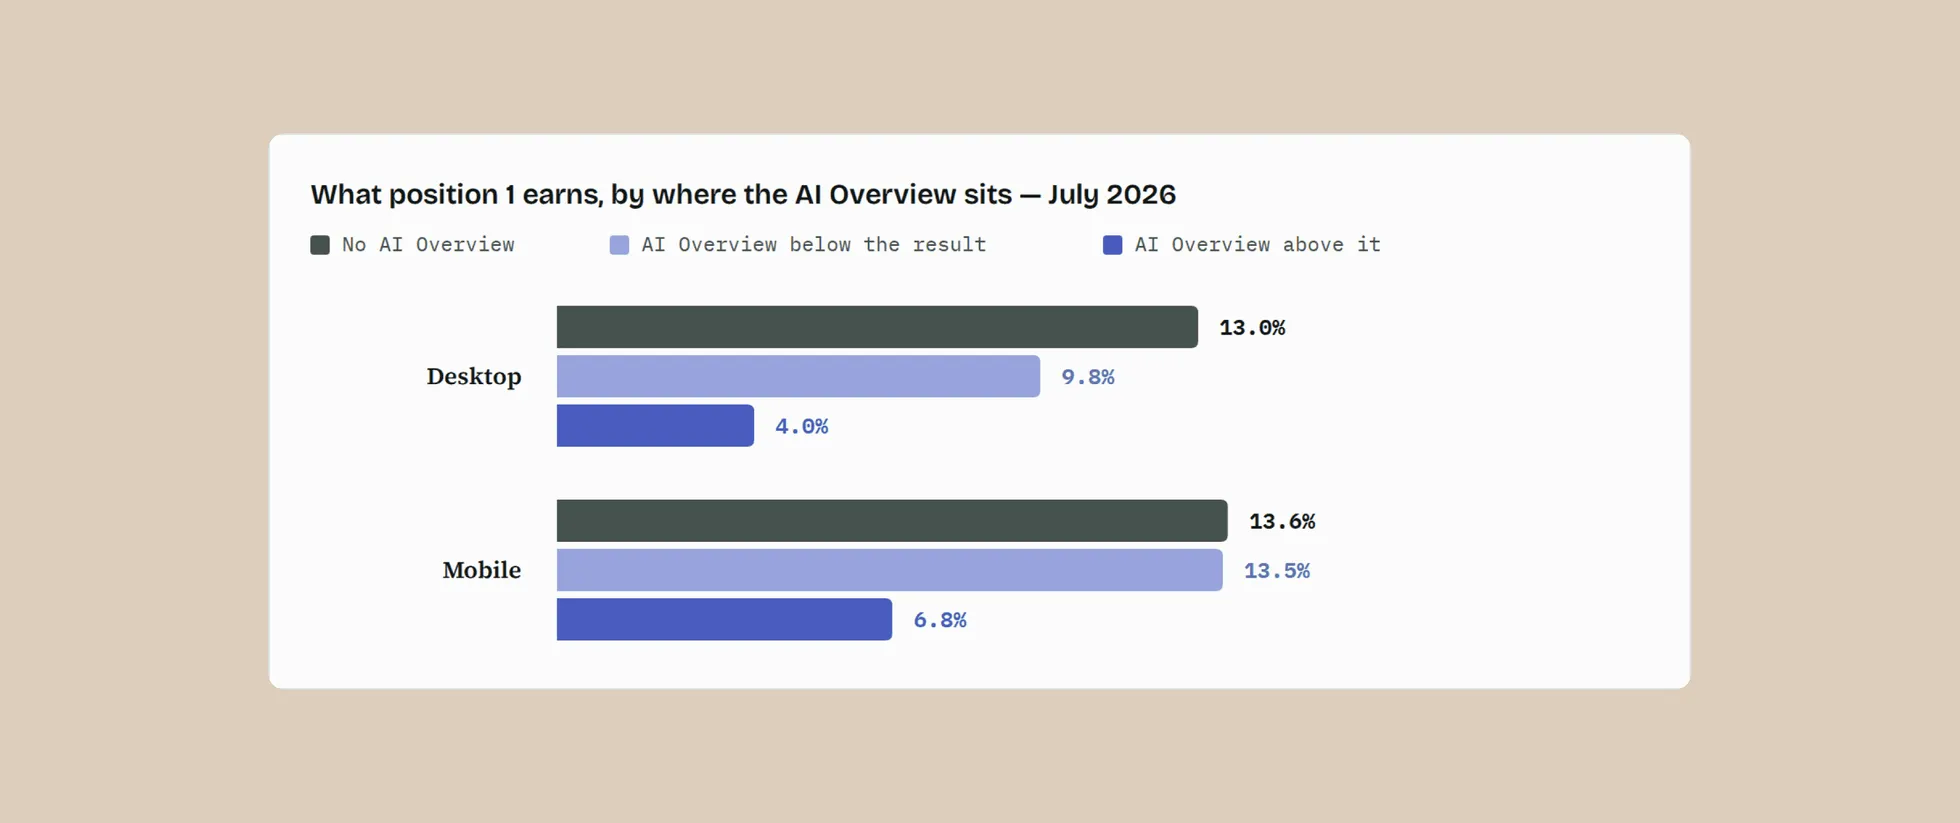
Where the AI Overview appears matters as much as whether it is there. When it sits above the position-1 result, that result gets less than a third of its clicks on desktop and half of them on mobile. When it sits below the result, the loss is much smaller, and on mobile, it is almost zero.
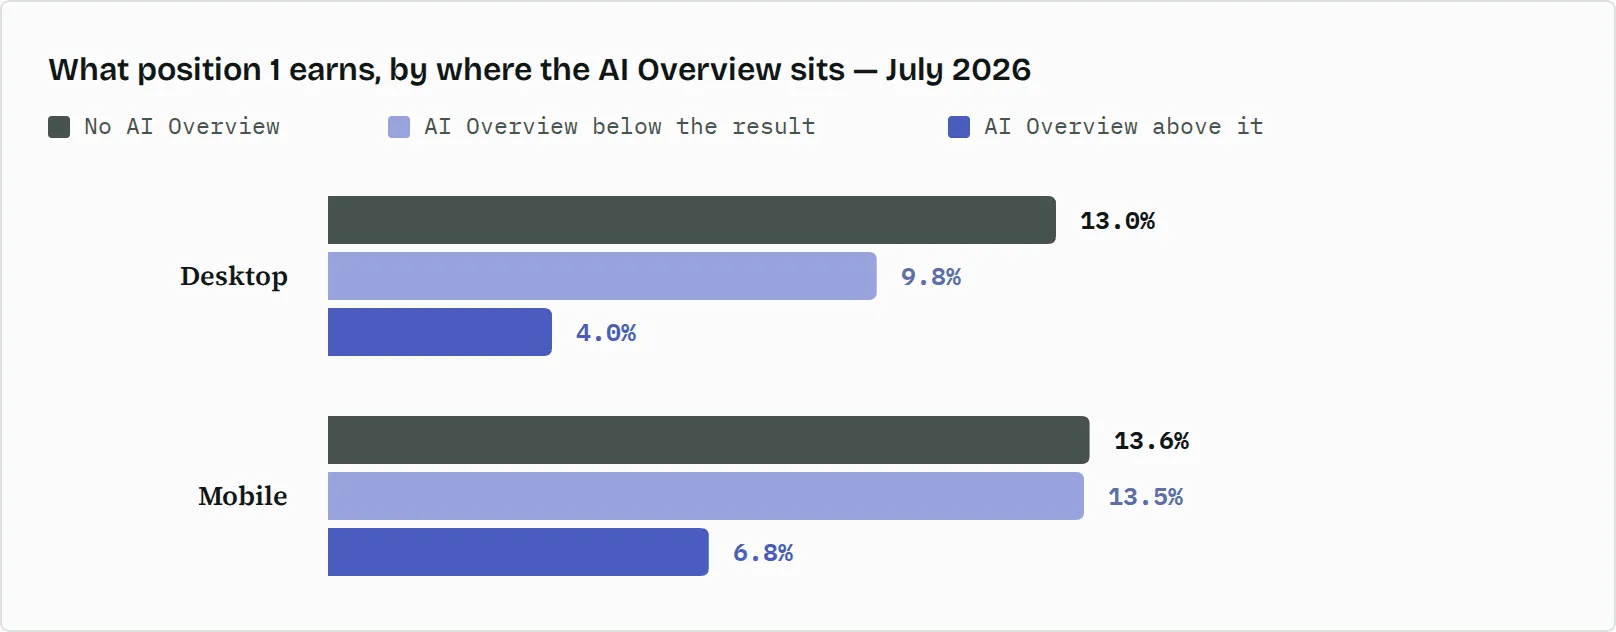 Position 1, July 2026, real Google Search Console CTR.
The fall is in what people do, not only in what Google Search Console counts. We also counted clicks per search, with Google Keyword Planner volume as the number of searches. With an AI Overview on the page, a position-1 result kept 38% to 64% of its clicks per search on desktop and 69% to 80% on mobile.
This matches what many SEOs see in their own Google Search Console: impressions hold, while clicks fall. Your ranking can stay exactly the same and still bring you fewer clicks because of what else is on the SERP.
The previous model estimated a milder effect
The previous CTR model already accounted for AI Overviews, but their impact on clicks has become bigger since we launched the model.
We tested the model using data from July 2026. When an AI Overview was on the page, the previous model estimated that the top three desktop results kept 68% of their clicks. In reality, they kept 44%. The new model estimates 45%, bringing the estimate much closer to what we actually see.
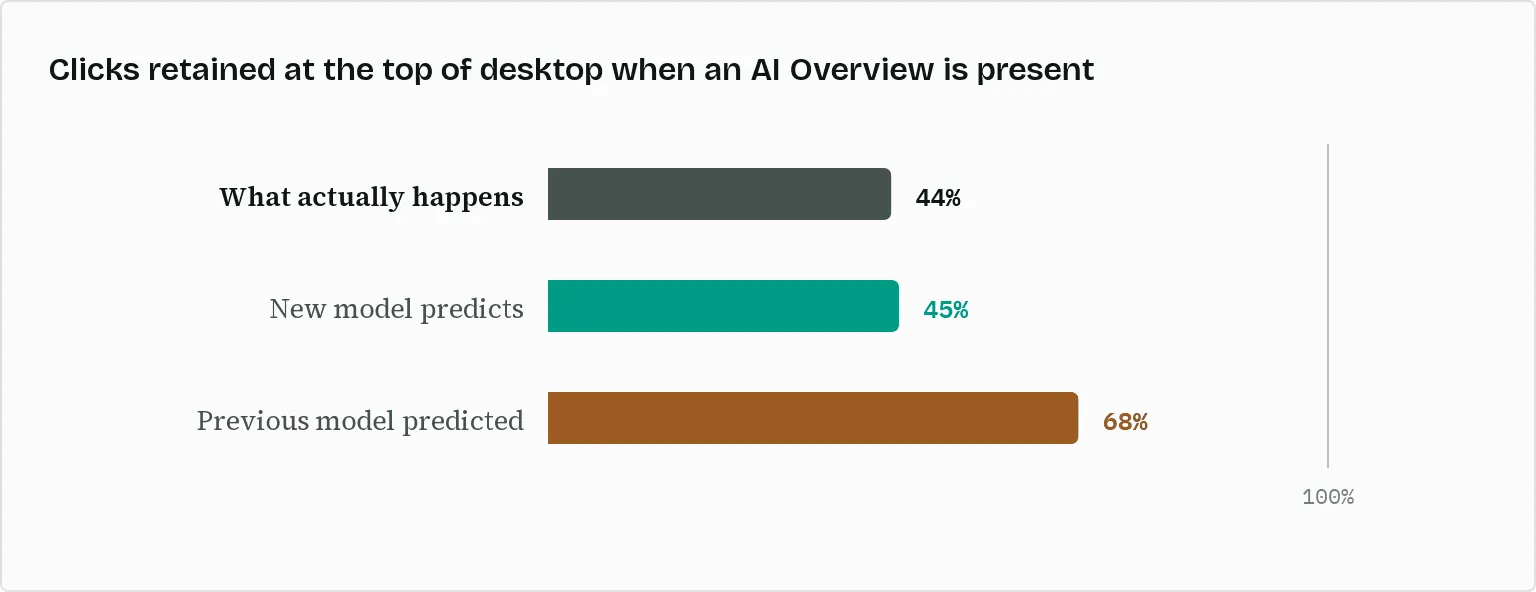 Desktop, top three positions, 63,269 tracked results, July 2026. The model iteration in this test was trained on data up to 30 June, so July was new to it.
The previous model also generally estimated higher CTRs. In the same test, results for positions 1–20 earned a 5.1% click-through rate on desktop. The previous model estimated 6.4%, while the new model estimates 4.8%. On mobile, the results earned 5.1%; the previous model estimated 6.1%, and the new model 5.0%.
The lower positions change most in relative terms and least in absolute terms. At positions 11–20, the estimate falls by about four-fifths on desktop, but that is less than one percentage point, because those results earn few clicks either way.
Why 10% at position 1?
Published CTR curves often put position 1 at about 30%. An average like that is easily pulled up by very large branded and navigational searches. For these searches, people often already know which website they want to visit, so the first result takes most of the clicks.
Your keyword list gives each keyword the same weight, and most tracked keywords are small: about three in four tracked desktop keywords are searched fewer than 1,000 times a month.
Weighted by Google Search Console impressions, so that the large searches count most, the change is small: the new model's position-1 estimate is about 3 percentage points below the previous model's on desktop and about 2 points below on mobile. The large change is in the smaller, everyday keywords that fill most keyword lists.
What We Rebuilt
Our Dynamic CTR has always looked at the actual SERP to estimate CTR rather than using a fixed CTR for each position. It has always considered factors such as pixel position, SERP features, and ads. That has not changed.
What has changed is how much of the page the model can see and the click data it learns from.
The model can now see the whole page
Previously, each training example was one result and a summary of the page around it: its rank, its pixel box, and yes/no flags such as "a featured snippet is somewhere on this page".
Now, we store every element of the SERP in order, with its pixel coordinates: ads, AI Overviews, featured snippets, local packs, People Also Ask boxes, and every organic result. This means the model knows what sits above a result, how tall each element is, and how far down the page the result starts.
Far more click data from current search behavior
We matched these pages to Google Search Console data: 674 million matched observations from 15 January to 24 September 2026. Thus, the model learns from this year's search behavior, including the September expansion of AI Overviews.
Only impressions from people
Google Search Console counts an impression each time Google shows a result. But not every SERP is loaded by a person. Automated clients also load SERPs but rarely click. For a keyword with thousands of searches each month, these automated impressions make little difference. But for a keyword with only 30 searches a month, they can make up most of the impressions.
Our data shows this clearly. At position 1 on desktop in July, keywords with a Google Keyword Planner volume of 1 to 30 recorded 16 times as many GSC impressions per search as keywords with a volume of 1,000 to 10,000. But they did not get fewer clicks per search: 1.3 clicks per 100 searches, against 0.8. Only the impressions were inflated.
The new model learns only from Google Search Console days with impressions that can be explained by human search. This filter removed 26% of the desktop data and 17% of the mobile data.
This filtering makes the estimates higher, not lower. An earlier version of the new model without this filter put desktop position 1 at less than half of the final value.
A tip for your own analysis: If you track long-tail keywords, be careful when interpreting their Google Search Console CTR. A low CTR can sometimes be caused by unusually high impression counts rather than fewer people clicking your result.
Same Rank, Different Page
Your rank tells you where your result sits among the organic results. But it does not tell you where the result appears on the page, or what appears above it.
Imagine two searches where your page ranks third. On page A, two ads appear above the organic results, and your result starts about 530 pixels from the top of the page. On page B, an AI Overview about 520 pixels tall sits above the organic results, and your result starts about 930 pixels down.
A rank report shows "3" for both. The model sees two different situations.
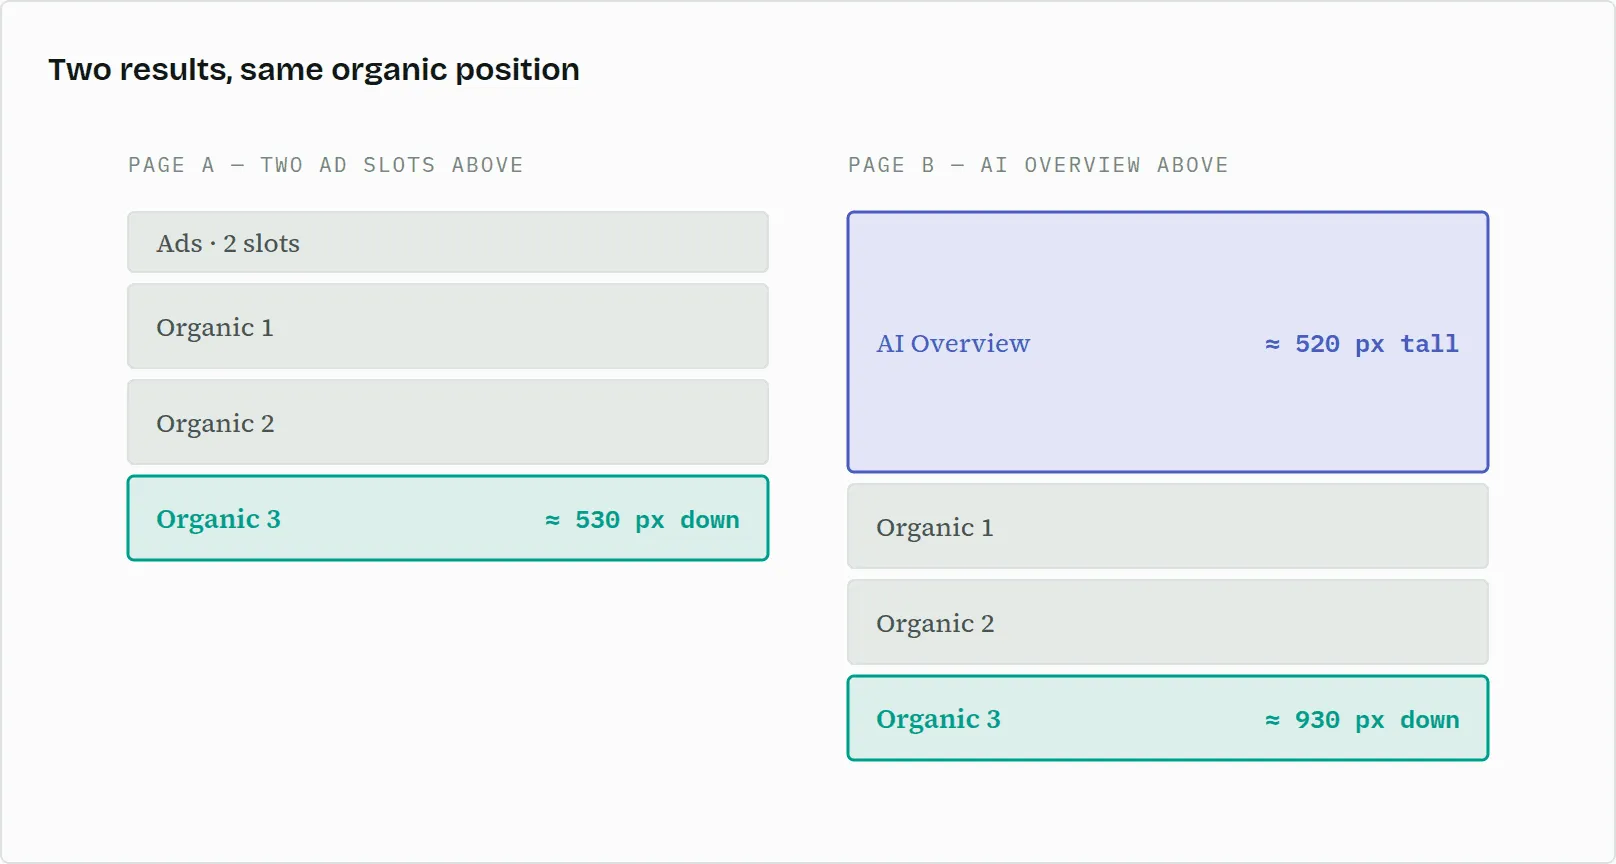 An illustration. In our data, results at the same organic position can sit hundreds of pixels apart.
What the model looks at
For organic 3 on page B, the model knows much more than "rank 3". It knows that the result starts about 930 pixels down and that it is the fourth element on the page. It knows that an AI Overview sits higher up. And it even knows the height of organic 2, the element directly above it.
In all, the model gets 104 signals for each tracked result. They fall into these groups:
- Where the result sits: How far down the page it starts, in pixels, and its place among all the elements on the page, with ads and SERP features counted.
- What sits directly above it: Whether that element is another organic result, how tall it is, and how much space there is between the two.
- The AI Overview: Whether there is one, where it sits, how many pages it cites, how long its text is, and whether it cites your domain.
- The rest of the page: Its layout, which SERP features and ads are on it and where, and which domains rank there.
- The result itself: How much space it takes up, whether it shows sitelinks, and the wording of its title and URL.
- The keyword: Its wording and the country you track it in, plus three figures. Two come from Google Keyword Planner: how much advertisers compete for the keyword, and its cost per click. The third is AR Search Volume, our own estimate of how often people search for it.
- The rank number.
What the model leans on most
We train separate models for desktop and mobile. In both models, three groups of signals carry about three-quarters of the weight:
1. Where the result sits, and what sits directly above it
43% on desktop and 45% on mobile, the largest group in both models. Inside this group, the model leans most on the element directly above the result. On desktop, that is the space between that element and the result. On mobile, it is how tall that element is.
2. Advertiser competition, cost per click, and search volume for the keyword
22% on desktop and 24% on mobile. Advertiser competition alone is the strongest single signal on mobile and the second strongest on desktop. These figures describe the keyword, not the page. So two keywords with very similar SERPs can still get different estimates.
3. What the result itself shows, mostly sitelinks
10% on desktop and 7% on mobile. In both models, sitelinks raise the estimate.
The rank number itself carries only 2%. Rank still matters. But a higher rank usually also means a higher place on the page, and signals that carry the same information share the credit. So read these figures as what the model leans on, not as what causes clicks.
Where the AI Overview sits
The model looks at where the AI Overview sits, not only whether there is one. That distinction matters. As the July 2026 figures showed, a position-1 result loses far more clicks when the AI Overview sits above it than when it sits below it.
The model gets each case right. In our September 2026 test, which we describe below, the model’s average position-1 estimate was within 5% of the real CTR in all three cases: AI Overview above the result, AI Overview below it, and no AI Overview.
The position of an AI Overview also changes. Take the desktop results pages with an AI Overview where a tracked domain ranks first. On 1 September 2026, the AI Overview sat below the position-1 result in 28% of cases, and one week later, in 37%.
Its position also differs between kinds of search. We grouped the same pages using AccuRanker's search intent model. For transactional searches, the AI Overview was the fourth element on the page or further down in more than a third of cases. On informational searches, that happened in about one in eight cases.
So simply knowing that a keyword has an AI Overview does not tell you how much traffic you might lose. Two keywords can both have an AI Overview but lose very different shares of their clicks.
What this means for your reporting
- Look past the rank. When a keyword keeps its rank but loses clicks, look at its SERP. Check what sits above your result now.
- Check where the AI Overview sits, not only whether there is one. At position 1, an AI Overview above your result and one below it are very different outcomes.
- Report desktop and mobile separately. An AI Overview costs a position-1 result more on desktop than on mobile. An average of the two hides that.
How We Tested It
We tested the new model on periods it had not seen during training, against real Google Search Console clicks.
- July 2026: Trained on data up to 30 June and tested on 1.7 million tracked results from 1 to 25 July. It was more accurate than the previous model across all position groups (1, 2, 3, 4–10, and 11–20) on both devices, with 23%-53% lower error. For 86% of the 5,696 domains with at least 1,000 impressions, the new model was closer to their own Google Search Console data.
- September 2026: Trained on data up to 14 September and tested on 1.2 million results from 15 to 24 September. At position 1, its average estimate was within 5% of the real CTR, with the AI Overview above the result, below it, or not on the page.
The model we release uses the same method on all data up to 24 September.
Why This Update Is Large, and the Next Ones Should be Smaller
This update is large because the SERP changed fast, and our training data had to change with it. The training data now comes from the same system that stores every SERP we track, matched to Google Search Console.
To add new months, we run that system again; we do not start a new project. We did exactly that this month: when Google expanded AI Overviews in September, we added August and September to the training data before this release.
We expect future updates to be much smaller than this one.
Related blog posts
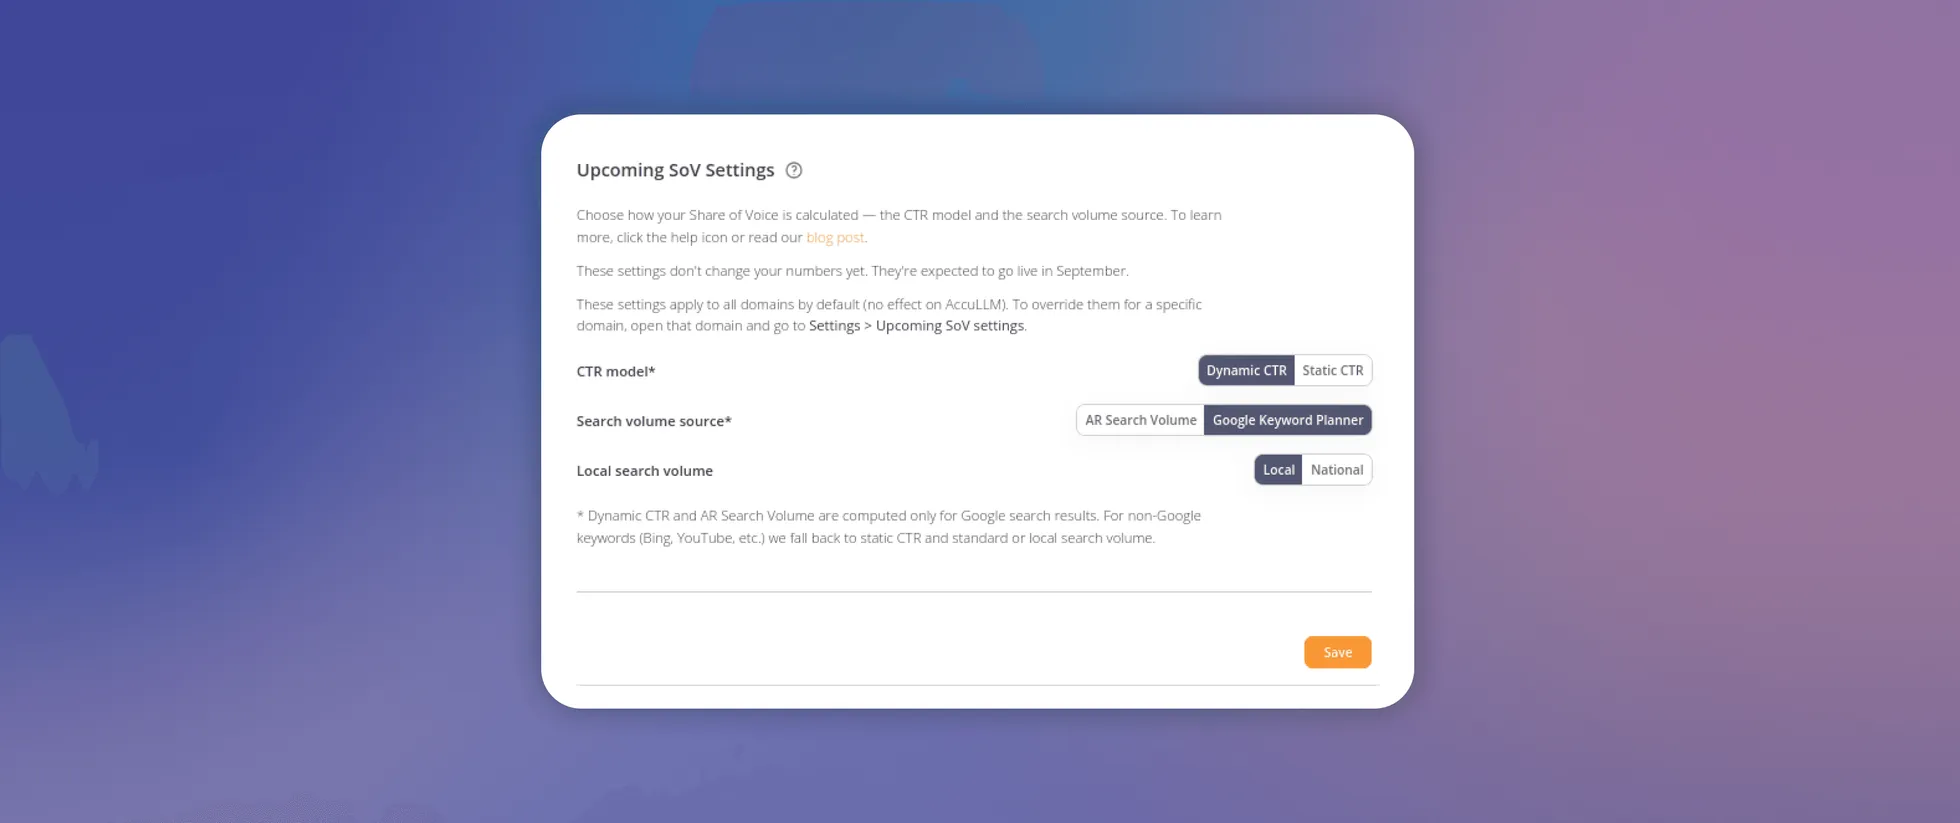
Share of Voice Update
We are changing how our Share of Voice metrics work. Read more about what we are changing and what you have to do.
2 July 2026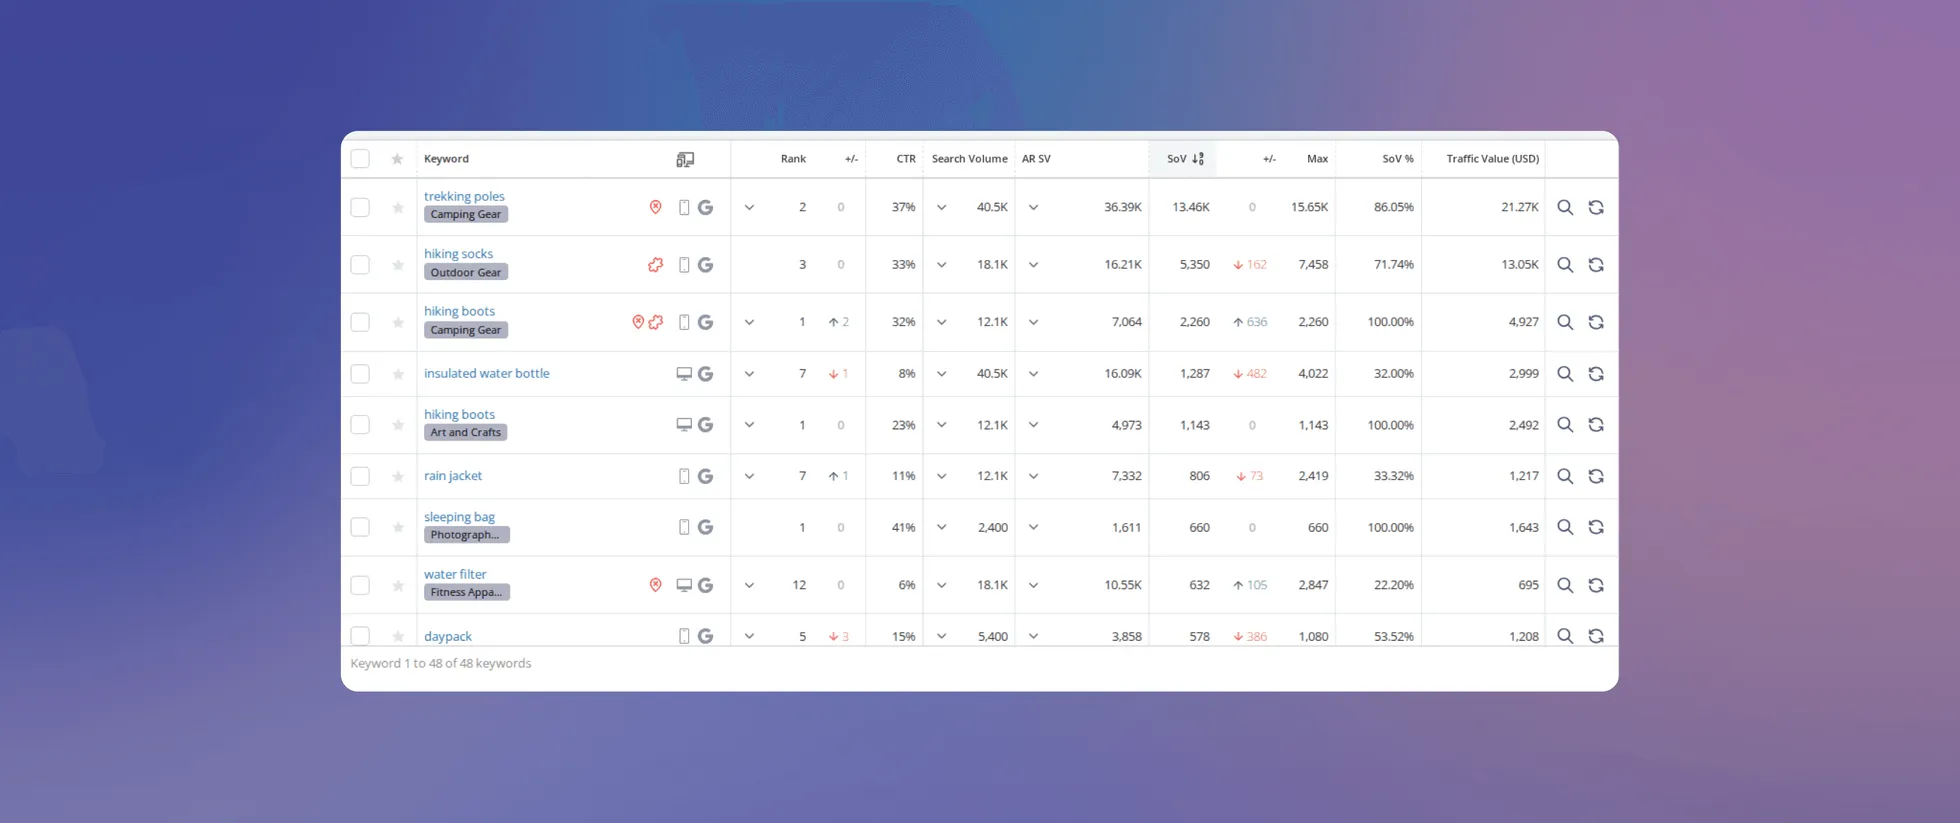
New Share of Voice: What Changes on October 21, 2026
Our Share of Voice is changing. See what is new, why we updated Dynamic CTR, and what to expect from your data when the changes go live.
7 October 2026
How to Choose the Best AI Visibility Tool
Learn how to choose the right LLM tracking tool to monitor AI visibility. We go through key features, integrations, capabilities, and budget.
1 October 2026